Productive Day
Morning Hustle: Giving It All for the Personal Project
Today marked another chapter in the adventurous coding journey of mine! The day kicked off at a cool 10:00 AM, with me diving headfirst into my brainchild, the “CodeTrack” project. Picture this: me, coffee in hand, staring at the screen, and ready to conquer the coding universe.
Guess what? Today’s conquest was adding the dynamic duo of data analysis features to my web application. How did I do it? Brace yourself, because I brought in the heavy artillery - the chart.js library! It’s like adding a splash of vibrant colors to a black and white world.
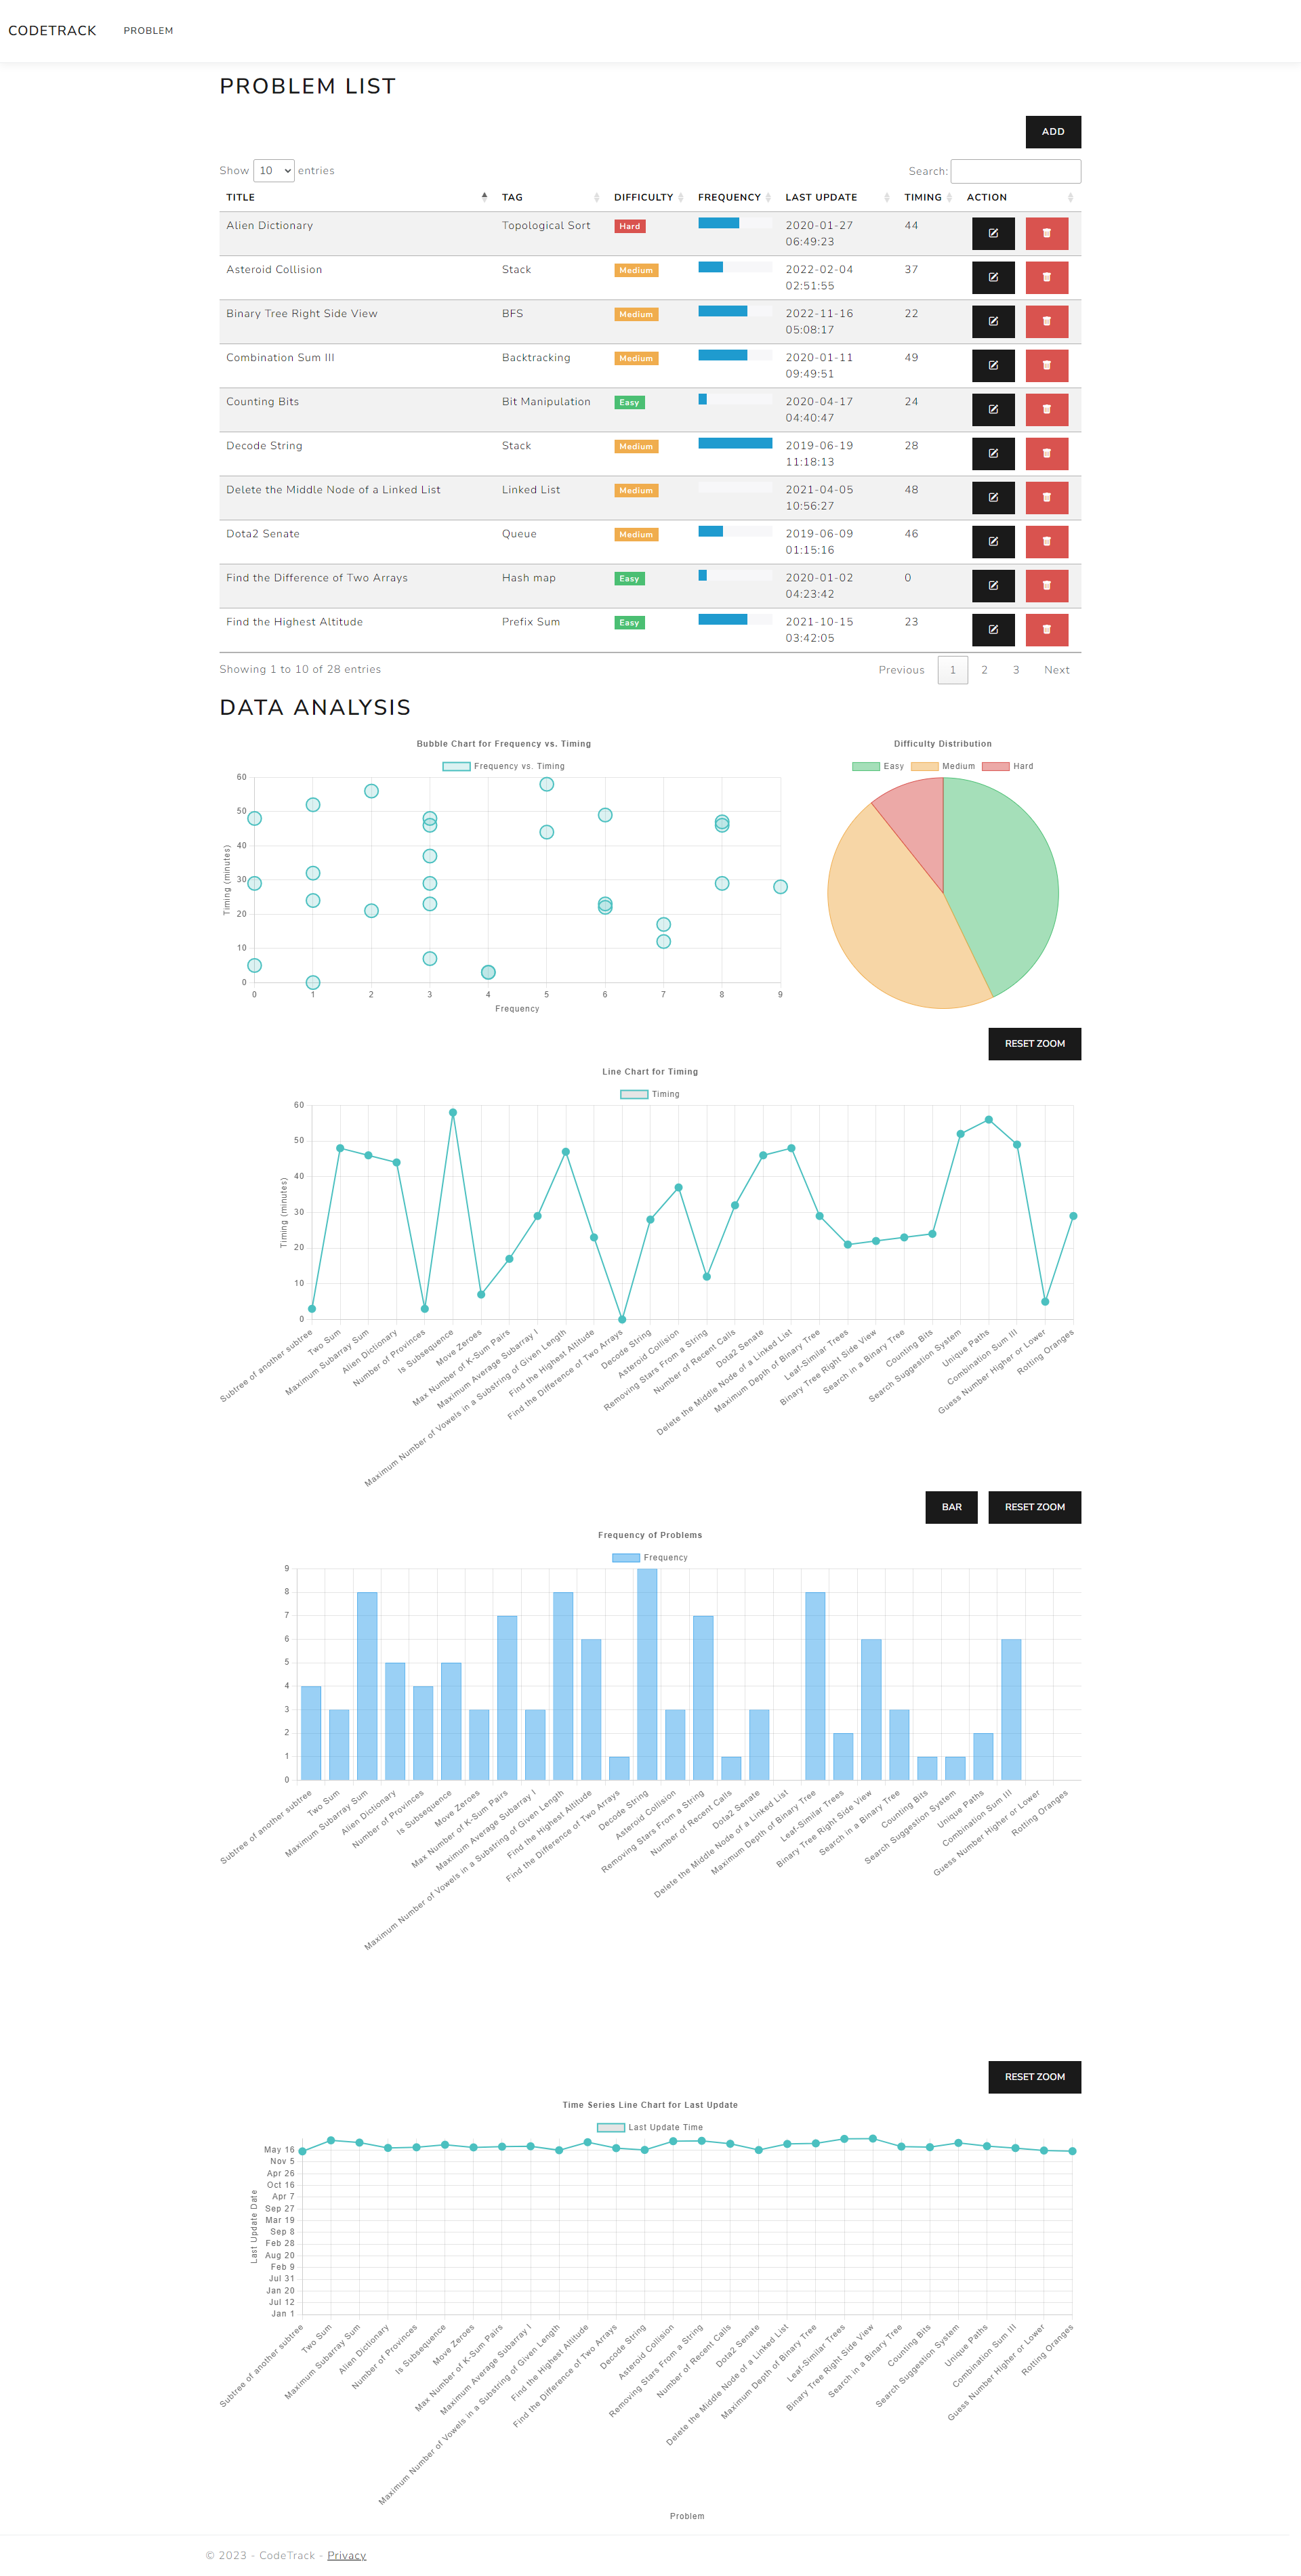
Here’s a sneak peek of the masterpiece in progress:
But, hold on a second – let’s talk about the real MVP here: ChatGPT. My coding comrade, my digital confidante. As I danced through the challenges, ChatGPT was my partner in crime, helping me brainstorm, problem-solve, and even write some sweet implementations. It’s like having a genius friend who’s always ready to lend a hand (or a line of code).
Now, I can’t help but ponder the future. As I blissfully basked in ChatGPT’s glory, a wild thought crossed my mind. Could this powerful tool replace the good ol’ Google Search or Stack Overflow? Are we on the brink of a coding revolution where ChatGPT becomes the coder’s ultimate sidekick?
Elevating CodeTrack: Strategies to Enhance Interest and Utility
But hey, let’s not get carried away with futuristic musings. Right now, all I care about is immersing myself in the coding cosmos, soaking up experiences, and becoming the coding maestro I aspire to be. Speaking of which, back to “CodeTrack”! What kind of charts did I conjure up today, you ask? Well, my friend, the possibilities are as endless as the code itself. Some are already tamed and ready to roll, but there’s a whole batch of chart ideas waiting for their moment in the spotlight.
Bar Chart for Frequency:Create a bar chart to visualize the frequency of each problem.Each bar represents a problem, and the height corresponds to the frequency.This can help identify which problems are more common.
Pie Chart for Difficulty Distribution:Use a pie chart to show the distribution of problems based on difficulty.Each slice represents a difficulty level, and the size corresponds to the number of problems in that difficulty category.
Line Chart for Timing:Create a line chart to show the timing of each problem.Each point on the line represents a problem, and the y-axis represents the time taken.This can help identify patterns or trends in the time taken for solving problems.
Bubble Chart for Frequency vs. Timing:Use a bubble chart to visualize both frequency and timing in a single chart.Each bubble represents a problem, and the position on the chart corresponds to the timing and frequency.The size of the bubble can represent another variable, such as difficulty.
Time Series Line Chart for Last Update:If you have a dataset with multiple updates over time, create a time series line chart.Show how the last update time changes over time for each problem.
- Grouped Bar Chart for Difficulty and Frequency:
- Create a grouped bar chart to show the relationship between difficulty and frequency.
- Each group represents a difficulty level, and within each group, bars represent the frequency of problems.
- Horizontal Bar Chart for Top Problems:
- Create a horizontal bar chart to show the top problems based on frequency or timing.
- This can help identify the most challenging or frequently encountered problems.
- Scatter Plot for Difficulty and Timing:
- Use a scatter plot to visualize the relationship between difficulty and timing.
- Each point represents a problem, with x-axis as difficulty and y-axis as timing.
- Radar Chart for Problem Characteristics:
- Create a radar chart to show various characteristics of problems (e.g., difficulty, timing, frequency) for a comprehensive overview.
- Donut Chart for Last Update Status:
- Use a donut chart to represent the distribution of last update status (e.g., recent, not updated). • Each segment represents a status category.
Breaking the Inertia: Embarking on a Fitness Journey After Years of Inactivity
At around 6:30 PM, I decided to ditch the couch and hit up my college buddy’s homemade gym. This guy turned his garage into a muscle-making haven, and he’s all about the squad getting fit together. And get this – no membership fees! He’s basically the fitness fairy, spreading gains and good vibes.
So, there I was, lifting, benching, and flexing for a solid two hours. My buddy, the gym guru, gave out tips like candy on Halloween – all for free! We went from warm-ups to full-on hardcore bench exercises. By the end, I felt like I could bench press a small car (not really, but you get the vibe).
Another Leetcode Challenge on the Road to Success. Keep grinding
Fast forward to 10:00 PM, and I’m feeling all pumped up – not just from the workout but also from the victory of tackling a Leetcode problem.
Check it out here: Loud and Rich. Now, I won’t lie, my solution was the tortoise in the race compared to others on Leetcode. But you know what? Snails gotta sprint before they become turbocharged, right?
Now, let me break it down for you – I was in full Sherlock mode, solving a graph problem with a dash of magic called Depth-First Search. It’s like navigating a maze, but instead of walls, you’ve got nodes and edges. My code was like the map that guides you through, step by step.
I won’t say it was the Usain Bolt of solutions, but to me, it felt like upgrading from a tricycle to a bicycle. Progress, people!
So, that was my day – from pumping iron in the friendliest garage gym to flexing my coding muscles on Leetcode. Who says you can’t have gains in both body and brain?
from collections import defaultdict
from typing import List
class Solution:
    def loudAndRich(self, richer: List[List[int]], quiet: List[int]) -> List[int]:
        def dfs(graph, node, quiet, visited, ans):
            if quiet[node] <= quiet[ans]:
                ans = node
            visited.add(node)
            for nei in graph[node]:
                if nei not in visited:
                    ans = min(ans, dfs(graph, nei, quiet, visited, ans))
            return ans

        graph = defaultdict(list)
        for src, dst in richer:
            graph[dst].append(src)

        result = []
        n = len(quiet)
        for i in range(n):
            visited = set()
            dfs.ans = i
            ans = dfs(graph, i, quiet, visited, i)
            result.append(ans)

        return result
As the clock struck midnight, I wrapped up the day by jotting down this journal entry. It’s my hope that someone might stumble upon these words and find a dose of motivation. And hey, maybe along the way, my writing skills get a little boost too.
For Future Me
Think of consistency and discipline as your trusty guides on this journey called success. Every tiny step you take today? It’s like a superhero leap toward the dreams waiting for you tomorrow. Keep those eyes on the prize, stay committed, stay focused. You’ve totally got this!
Cheers to chasing dreams and leveling up, one day at a time! Stay strong and until the next chapter unfolds!